
Let’s be honest—tweeting without checking analytics is like shouting into a canyon. You might hear an echo, or maybe nothing at all. But once you unlock your Twitter (X) account analytics, it feels like stepping into a secret control room. Suddenly you can spot patterns in how people respond to your content, identify the posts that quietly move the needle, and turn guesses into testable strategies.
Ready to go behind the curtain? Let’s explore how to access your analytics and dive into one of the most revealing metrics: impressions.
How To See Twitter Analytics: Unlock Your Performance Dashboard (the real deal)
Most users don’t realize they already have a treasure trove of data. The Twitter Analytics Dashboard is the place where your account’s story becomes visible — think of it as your personal performance command center.
Here’s what to expect and how to get there:
- Per-tweet analytics : Any user can view detailed analytics for individual tweets by opening a tweet and tapping the small graph/bar-chart icon (often labeled “View Tweet activity”). That popup shows impressions, total engagements, link clicks, profile visits, and other per-tweet details. It’s the fastest way to inspect a single tweet’s footprint.
- Account-level dashboard (access may vary): You can try visiting
analytics.twitter.com(or the account analytics URL on X) to reach an overview of your account: a 28-day summary, impressions, engagement rate, profile visits, and content insights. Note that the depth of what you see can vary by account — per-tweet metrics are widely available, while deeper historical exports and some advanced account-level features may be limited or tied to account settings or subscription tiers.
How to open the dashboard :
- Desktop: Log in to your account, then visit the analytics URL to see your account overview if available.
- Mobile app: Open any of your tweets and tap the graph/bar-chart icon to view that tweet’s activity. The mobile experience tends to emphasize single-post analytics; full dashboard functionality on mobile may be more limited.
Think of the bar-chart icon as your per-tweet magnifying glass and the analytics site as the full map — you’ll often start with the magnifying glass and graduate to the map when you want the bigger picture.
How To Check Impressions on Twitter: Discover How Many People Saw Your Tweets
Impressions are one of the first, most illuminating numbers you’ll encounter.
What is an impression?
An impression is recorded each time your tweet is displayed on someone’s screen—on a timeline, in search results, or elsewhere. It doesn’t mean the person read or interacted with it; it just marks that the tweet was viewable.
If you’re interested in what you can’t see—like someone’s likes on Twitter and why they’re not always visible—that’s a different story. Analytics focuses on your own data, not private activity.
How to check impressions (step-by-step):
- Find the tweet you want to inspect.
- Click or tap the graph / bar-chart icon under that tweet (often labeled “View Tweet activity”).
- The Tweet Activity panel opens and shows impressions, total engagements, engagement rate, link clicks, profile visits, and other interaction breakdowns for that specific tweet.
What the impression number tells you (and what it doesn’t):
- High impressions = your tweet reached many timelines (visibility).
- High impressions + low engagement = it was seen but didn’t compel action—maybe tweak the copy, CTA, or media.
- Low impressions = consider timing, hashtags, or format changes to increase reach.
Don’t treat impressions as the final verdict—use them as the reach signal in your detective kit. Combine impressions with clicks, replies, and saves to diagnose what’s actually working.
Why Analytics Feels Like Your Secret Weapon
Analytics isn’t just numbers—it’s like finding a secret map that reveals how your audience thinks and reacts. Each metric is a clue, guiding you toward what actually works. Here’s why it feels like your ultimate edge:
- Reveal Patterns
Analytics uncovers trends you’d never notice on your own. Maybe your threads thrive in the morning, or memes take off on Fridays. These patterns give you a clearer path forward.
- Test Smarter
Instead of posting blindly, you can experiment with timing, hashtags, or tweet formats. Analytics quickly shows which version resonates, turning guesswork into evidence.
- Go Beyond Vanity Metrics
Likes feel good, but impressions, engagement rates, and clicks reveal the bigger story. They show whether people simply saw your tweet—or actually acted on it.
- Track Progress
Looking at analytics over weeks or months is like flipping through a growth diary. You can see exactly how your strategies evolve and where momentum builds.
- Anticipate Trends
With enough data, you begin predicting what your audience will engage with. It’s almost like reading the algorithm’s playbook before anyone else does.
In short, analytics transforms Twitter from a noisy stream into a strategy game—once you know the rules, you’re not just tweeting, you’re competing to win.

Twitter Analytics Not Working? Common Reasons and How to Fix Them
Analytics is powerful—until it suddenly stops working. Maybe the dashboard won’t load, metrics look blank, or features just don’t show up. Don’t worry—these issues are common, and most can be fixed without too much hassle.
One reason you might not see the full dashboard is that not every account has the same level of access. Everyone can view per-tweet analytics, but the more detailed, account-level overview may only appear for certain accounts or Premium subscribers. If you’re missing the full dashboard, check your account settings or consider whether an upgrade is needed.
Sometimes the problem comes from your own device. Old cache files, cookies, or outdated apps can cause analytics to freeze. Clearing your cache, updating the app, or logging in through a different browser usually clears things up. If you’re using ad blockers or browser extensions, those can also interfere with the page—try disabling them or opening analytics in a private window to see if it loads properly.
There are also times when the issue is on Twitter’s side. Server hiccups or platform updates occasionally take analytics offline. In that case, the best move is simply to wait a bit and check back later. Rarely, access problems can be tied to account security flags or verification requests, so it’s worth checking your notifications to make sure nothing is holding your account back.
If you’re ever stuck, here’s a quick fix checklist:
- Test per-tweet analytics first (click the bar-chart icon under a tweet).
- Clear cache and cookies, then refresh.
- Try another browser or device.
- Disable extensions and ad blockers.
- Check account notifications or subscription status.
In most cases, issues clear up by step 3. Think of it like tuning a radio—adjust the dial a little, and the signal comes back loud and clear.
What You Can Discover From Your Twitter Analytics Dashboard
Once your analytics is up, treat it like a control panel — organized by the insights it delivers. Below is a neat, actionable structure you can follow when you explore.
A) Core performance (Per-tweet metrics)
What you see: Impressions, total engagements, engagement rate, link clicks, profile visits for each tweet.
This tells you which single posts captured attention and which formats (threads, images, polls) perform best. Start here for quick wins.
B) Audience & growth trends
What you see: Follower growth over time, spikes/dips by date, and sometimes basic audience breakdowns.
Correlate follower changes with specific tweets or campaigns to learn what attracts or repels followers; this helps you refine voice and topic focus.
C) Engagement drivers & top content
What you see: Lists of top tweets, top mentions, and tweets that drove the most clicks or retweets.
Replicate winning formats and nurture relationships with accounts that amplify your reach. Use “top tweets” as a mini playbook.
D) Traffic signals (link clicks & profile visits)
What you see: How many people clicked your links, how many visited your profile after a tweet.
These metrics bridge social visibility and real action—important if you’re driving readers to a site, sign-up, or product page. If impressions are high but clicks are low, optimize CTAs and link placement.
E) Monthly snapshots & historical views
What you see: At-a-glance monthly highlights (top tweet, top mention, 28-day summaries) and, if available, exportable history.
Use monthly summaries to spot recurring themes, plan content calendars, and measure long-term strategy shifts. If native historical exports aren’t available, consider a reputable third-party analytics tool.
F) Alternatives & complements
If native analytics feels limited, third-party tools or guides like how to view private Twitter accounts in 2025 can help you understand what’s public vs. private and expand your toolkit.

Need to Browse X Profiles Anonymously? Try ArchivlyX’s Twitter Viewer
Analytics tells you how your own content performs, but sometimes you want to look outward. Maybe you’re researching competitors, checking out another creator’s style, or simply scrolling a public profile without signing in. In those cases, a reliable Twitter viewer is exactly what you need.
That’s where ArchivlyX’s Twitter Viewer comes in. Available on both desktop and mobile, it makes anonymous browsing effortless—no login required, no regional barriers, just clean and simple access to public content.
Who It’s For
- Creators & Influencers – Compare your performance with peers, find inspiration from trending posts, and explore freely without alerting anyone.
- Businesses & Marketers – Monitor competitor activity, track product mentions, and gather content ideas—even in markets where X is restricted.
- Everyday Users – View and save tweets from favorite accounts without the hassle of signing in. Perfect for casual browsing on the go.
Key Benefits
- 100% free Twitter/X viewer
- Works seamlessly on both mobile and desktop
- Access public profiles without logging in
- Functional in regions where X is blocked or throttled
- Download images, videos, and GIFs directly
- Clean, ad-free interface for distraction-free browsing
How It Works
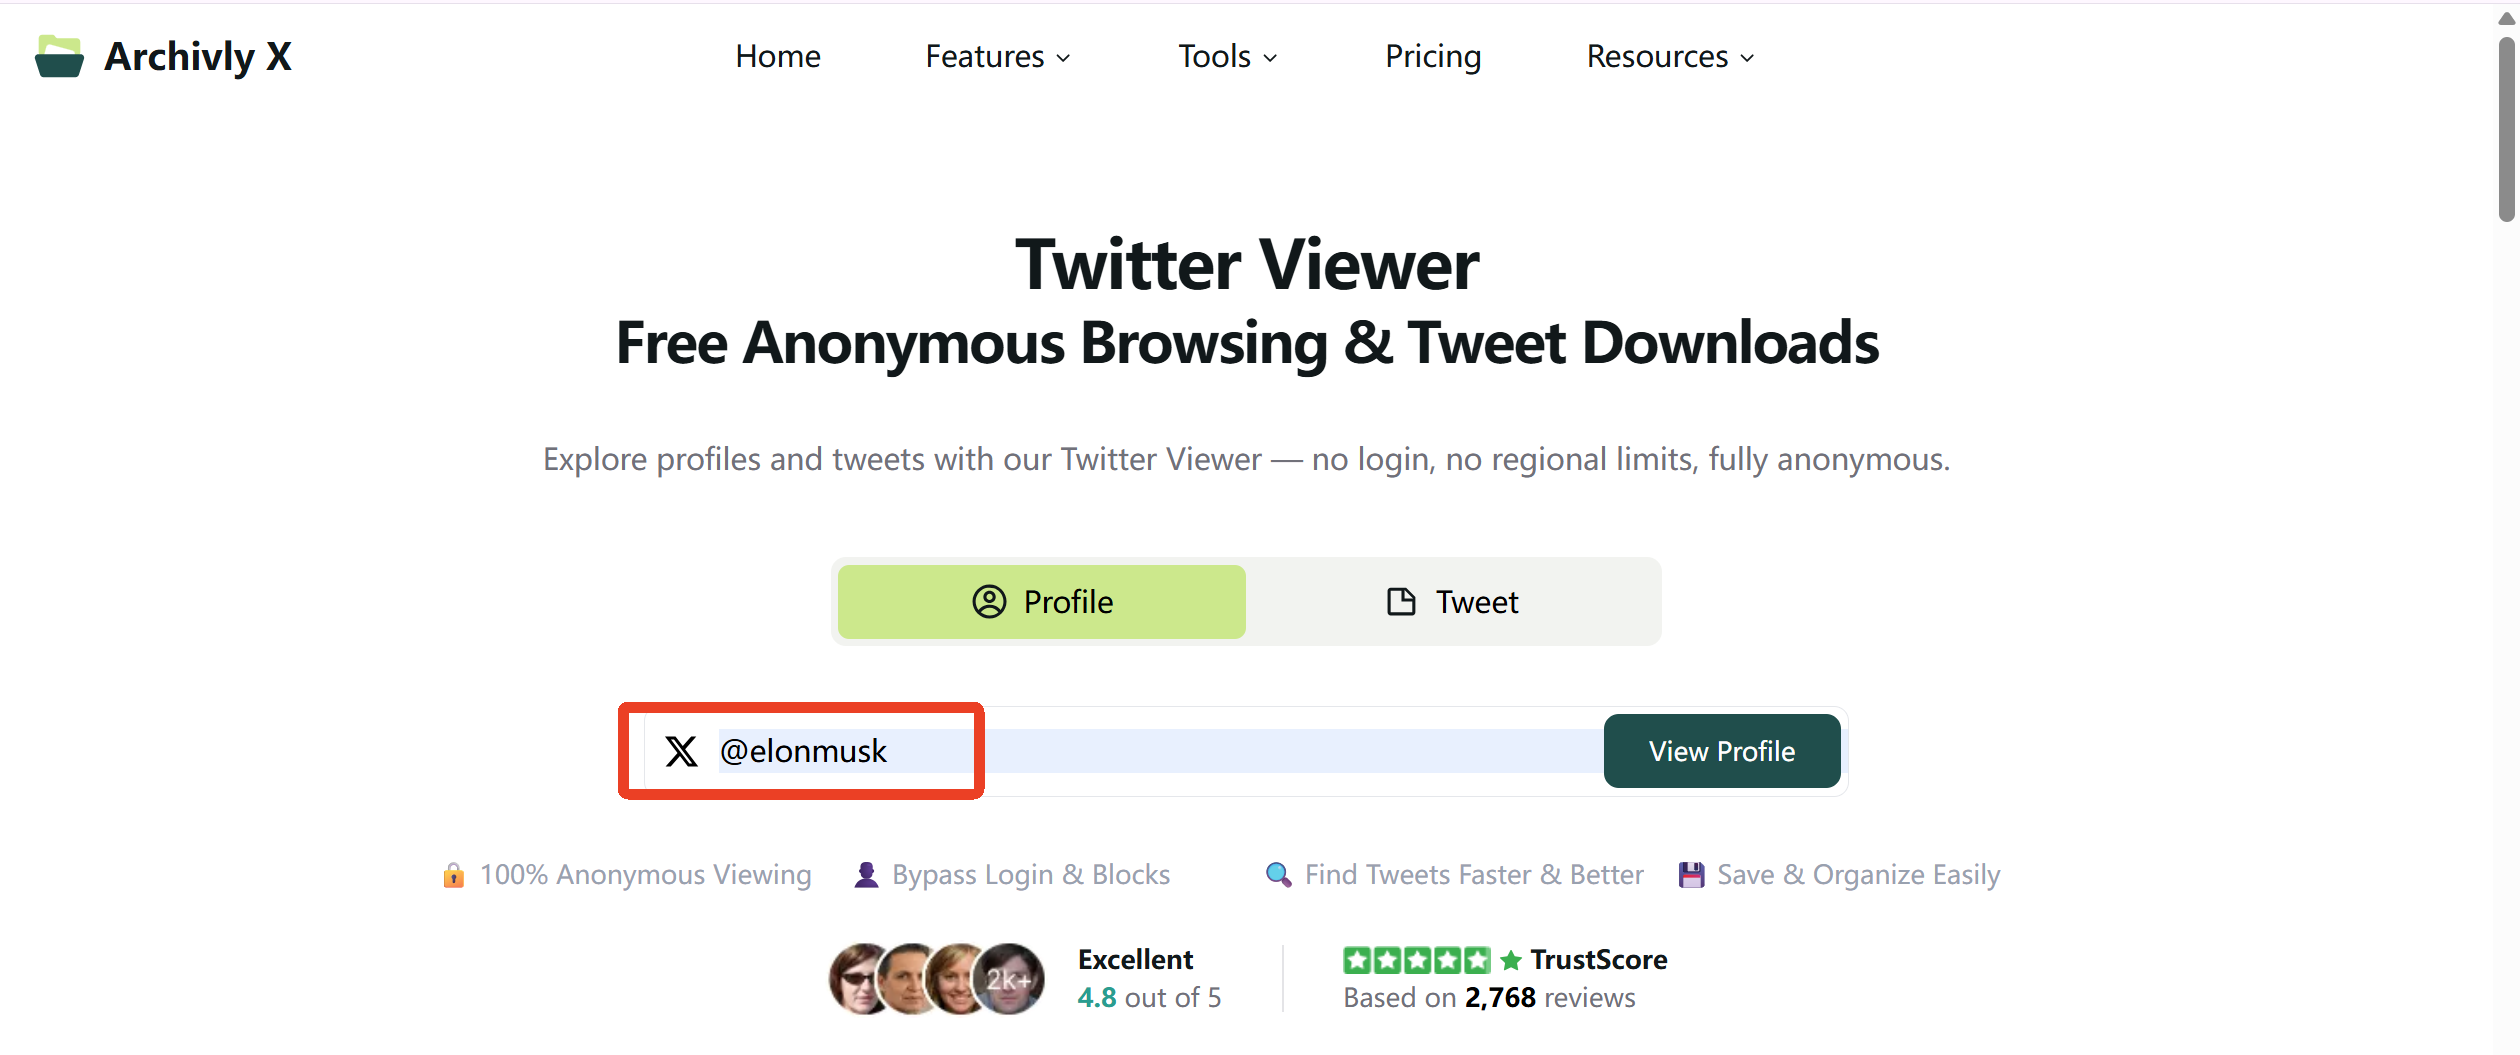
- Open ArchivlyX’s Twitter Viewer on your phone or computer.
- Enter the @username of the account you want to check out.
- Instantly see their public tweets—completely anonymous.
- Save any media you like straight to your device.
Ready to Explore Twitter Smarter?
Whether you’re diving into your own analytics dashboard to understand performance, or using ArchivlyX’s Twitter Viewer to browse profiles anonymously, the tools are right at your fingertips. Don’t just tweet into the void—start exploring the data, trends, and content that actually shape your experience on X.
👉 Check your analytics today, try out ArchivlyX, and take control of how you use Twitter.


