
Twitter following analysis focuses on who an account follows, using public profile metadata to identify consistent patterns (topics, ecosystems, geography, and network maturity). This differs from follower analysis, which is primarily about the account’s audience.
This article supports the ArchivlyX Twitter Exporter page by (1) defining a minimal, repeatable following analysis method, and (2) demonstrating what the method produces using a real following-list export of 977 accounts.
Definition: what “Twitter following analysis” covers
A standard following analysis uses only publicly visible profile fields and aims to answer four operational questions:
1. Topic coverage: what themes dominate the followed accounts’ bios and websites
2. Ecosystem proximity: whether the following list clusters around specific organizations, communities, or roles
3. Geographic concentration: whether the network is anchored in a few regions
4. Network maturity: whether the following set skews toward established accounts (account age)
This approach avoids subjective interpretation and does not rely on timeline assumptions.
Why metadata is sufficient for initial conclusions
The following analysis is feasible because profile metadata carries stable, interpretable signals (bio text, location, join date, and basic counts). Platform-level product direction has also moved toward surfacing more “account context” and transparency cues, reinforcing the practical value of metadata for interpretation.
Minimum viable field set (what you should export)
For a following analysis that remains lightweight but defensible, the exporter should include:
• Handle, profile URL
• Bio
• Location
• Website
• Joined date (account age)
• Followers count, following count
• Posts count
• Verification/profile completeness signals (where available)
In most analyses, bio, joined date, and location account for the majority of actionable insights.
Case study: @sama following list
The following findings are derived from a structured export of Sam Altman (@sama)’s following list (977 accounts). The purpose is methodological: demonstrate what becomes observable once the list is exported.
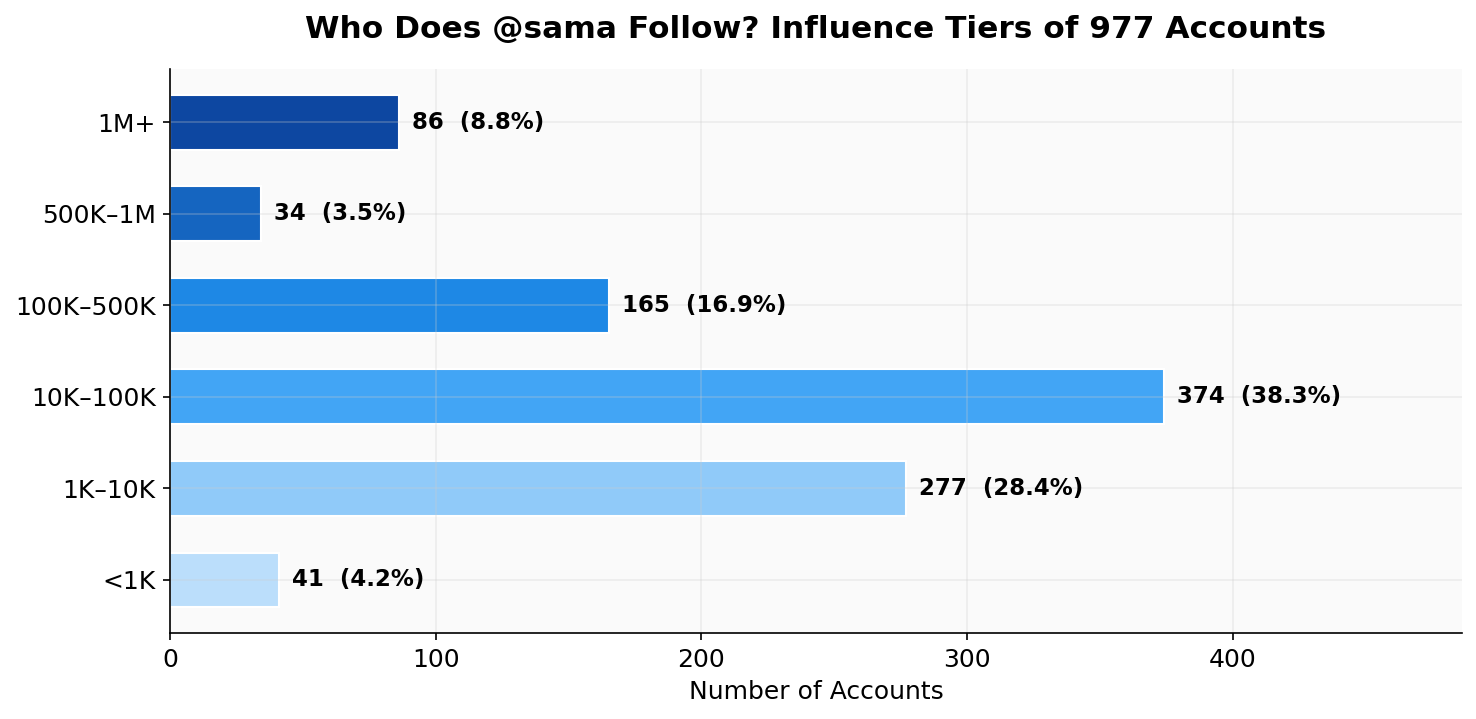
Influence tiers (follower count distribution)
The distribution indicates that the following set is dominated by mid-tier accounts rather than exclusively high-visibility profiles:
• 10K–100K: 374 (38.3%)
• 1K–10K: 277 (28.4%)
• 100K–500K: 165 (16.9%)
• 1M+: 86 (8.8%)
• <1K: 41 (4.2%)
Interpretation: A following list can represent both “high-attention” accounts and operator-level sources. Exporting enables this distribution to be assessed directly.
Geographic concentration (location clustering)
Despite missing location values, clear clustering is visible:
• SF Bay Area: 375 (38%)
• New York: 66 (7%)
• No location: 239 (24%)
• Other: 244 (25%)
Interpretation: Even with free-text location noise, exported data allows rapid assessment of network anchoring and regional concentration.
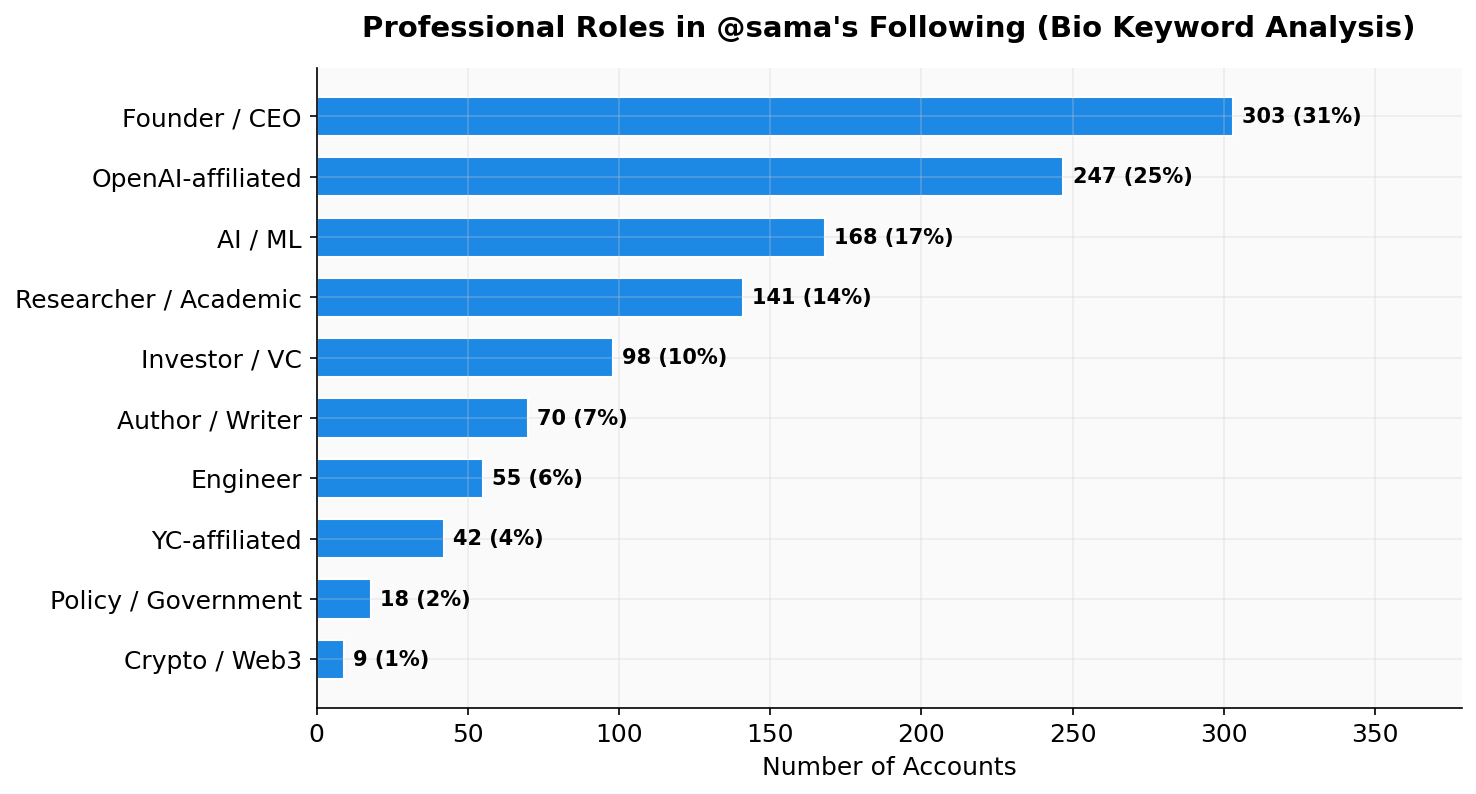
Role and affiliation signals (bio keyword analysis)
Bio keywords show a strong concentration in builder and research roles:
• Founder / CEO: 303 (31%)
• OpenAI-affiliated: 247 (25%)
• AI / ML: 168 (17%)
• Researcher / Academic: 141 (14%)
• Investor / VC: 98 (10%)
• Author / Writer: 70 (7%)
Interpretation: The following analysis can approximate ecosystem composition by role/affiliation using bios as the primary semantic field.
Network maturity (account age distribution)
The join-date distribution skews toward earlier Twitter adoption years, with a visible concentration in late-2000s / early-2010s cohorts.
Interpretation: Older cohorts often imply a more established network and reduce the likelihood that the set is primarily driven by short-term discovery.
Method note: treat the following as a snapshot, not a timeline
The following lists should not be treated as a reliable “recent follows” timeline. Ordering and visibility can vary. For analysis, the correct assumption is that the export represents a snapshot at the time of collection.
Lightweight procedure (recommended workflow)
1. Export a public account’s following list to CSV/Excel
2. Run a minimal scan:
• bio themes (3–5 keywords)
• affiliation clusters (repeated org/community mentions)
• location clustering (major hubs + missing share)
• account age distribution (cohort skew)
3. For quality review, flag low-signal profiles for manual checks (empty bio, default avatar, repetitive handles)
Conclusion
Twitter following analysis is best approached as metadata-based pattern detection. When the following list is exported into structured fields, it becomes possible to evaluate topic coverage, ecosystem proximity, geographic concentration, and network maturity with minimal manual effort. The @sama example illustrates how these dimensions appear clearly once the list is treated as a dataset rather than a scrollable UI.


