
Sure, likes and retweets feel good — that quick hit of validation is addictive. But if you really want to know what’s going on with your Twitter (now X) content, you need to dig deeper. That’s where Twitter Analytics comes in: your backstage pass to everything your tweets are doing when you’re not looking.
Whether you’re a casual scroller, a side-hustling creator, or a brand trying to nail your social media strategy, X Analytics can help you post smarter, reach more people, and actually understand your audience. Let’s unpack it.
X Analytics 101: What It Is and Why You Should Care
Think of X Analytics as your personal scoreboard. It doesn’t just count the obvious stuff like likes and retweets — it measures how people interact with your content, who is engaging, and what makes your posts worth clicking.
With this built-in tool, you can:
- See which tweets get the most impressions, clicks, and shares.
- Track your follower growth (or loss — no judgment).
- Understand what kind of media — videos, GIFs, polls — your audience prefers.
- Spot trends over days, weeks, and months to guide future posts.
It’s the difference between tweeting in the dark and tweeting with a spotlight on your best moves.
Related: If some tweets are hidden behind content warnings, here’s how to view sensitive content on Twitter so you can see the full picture in your analytics.
Step-by-Step: How to Access X Analytics
On Desktop (Full Dashboard Mode)
- Log into your X account.
- Click your profile picture in the top right corner.
- Select Analytics from the drop-down menu — or skip the clicks and go straight to analytics.twitter.com.
- Voilà: your 28-day summary appears, along with deeper insights when you click into specific tweets.
On Mobile (Quick Peek Mode)
- The app doesn’t have the full dashboard, but you can still check individual tweet stats:
💡 Pro Tip: Want the full desktop dashboard on your phone? Open your mobile browser, visit analytics.twitter.com, and log in — same data, smaller screen.
The Numbers That Matter: Key Metrics in X Analytics
When you first open X Analytics, the dashboard can feel overwhelming. Breaking it down into categories makes it easier to digest:
1. Reach & Visibility – How many people are seeing your content
- Impressions – Times your tweet appeared in feeds or search results.
- Profile Visits – Number of times users visited your profile from a tweet.
2. Engagement & Interaction – How your audience responds
- Engagements – Total actions (clicks, likes, replies, retweets, follows).
- Engagement Rate – Percentage of impressions that resulted in actions.
- Likes – Quick signals of approval.
- Retweets – Shares that extend your reach.
- Follows – New followers gained from a tweet.
3. Content Performance – How specific media and formats perform
- Link Clicks – Clicks on URLs in your tweet.
- Video Views – Times a video in your tweet was played.
- Top Tweets – Your best-performing tweets in a selected period.
Related: Lost track of a post you deleted? You might still be able to find it — here’s how to view deleted Twitter posts.
Who Is X (Twitter) Analytics For?
Not everyone uses X the same way — but almost everyone can benefit from its analytics tools. Broadly speaking, the people who get the most out of X Analytics fall into three main groups:
1. Creators and Influencers – Building an Audience from Scratch

If you’re trying to grow your personal brand, land sponsorships, or simply make your voice heard, analytics is your best friend. Instead of guessing which posts will resonate, you can actually see:
- Which topics get the most impressions and engagement.
- What posting times lead to higher interaction rates.
- Which formats — text-only, images, videos, polls — your audience responds to best.
A travel vlogger might notice that photo threads get twice the engagement rate of single-photo posts. Armed with that insight, they can shift their content mix to maximize reach.
Bottom line: Creators who check analytics regularly learn faster, grow faster, and waste less time on content that doesn’t work.
2. Businesses and Marketers – Driving Traffic, Leads, and Sales

For companies, Twitter isn’t just about likes — it’s a marketing channel that can directly influence revenue. With X Analytics, businesses can:
- Measure campaign performance in real time.
- Track how many users click product links or visit landing pages.
- Spot which promotions, announcements, or hashtags generate the most buzz.
An e-commerce store could compare engagement rates between organic posts and promoted tweets, then reallocate budget to the highest performers.
For marketers, this is also about reporting — analytics data can prove ROI to clients or stakeholders, making future campaigns easier to justify.
3. Everyday Users – Satisfying Curiosity and Spotting Surprises

You don’t need a business plan to find X Analytics fascinating. Even casual users who tweet once in a while can enjoy:
- Discovering which tweets unexpectedly take off.
- Seeing if certain friends or followers engage more than others.
- Tracking personal milestones like follower growth over time.
Maybe you posted a random photo of your pet and it became your most-liked tweet ever. Analytics tells you exactly how many people saw it, liked it, and shared it — and might inspire you to post more pet pics.
For hobbyists, analytics is less about “strategy” and more about having fun with your own digital footprint.
Related: Ever wondered if people know you’ve visited their profile? Here’s the truth about Twitter profile views.
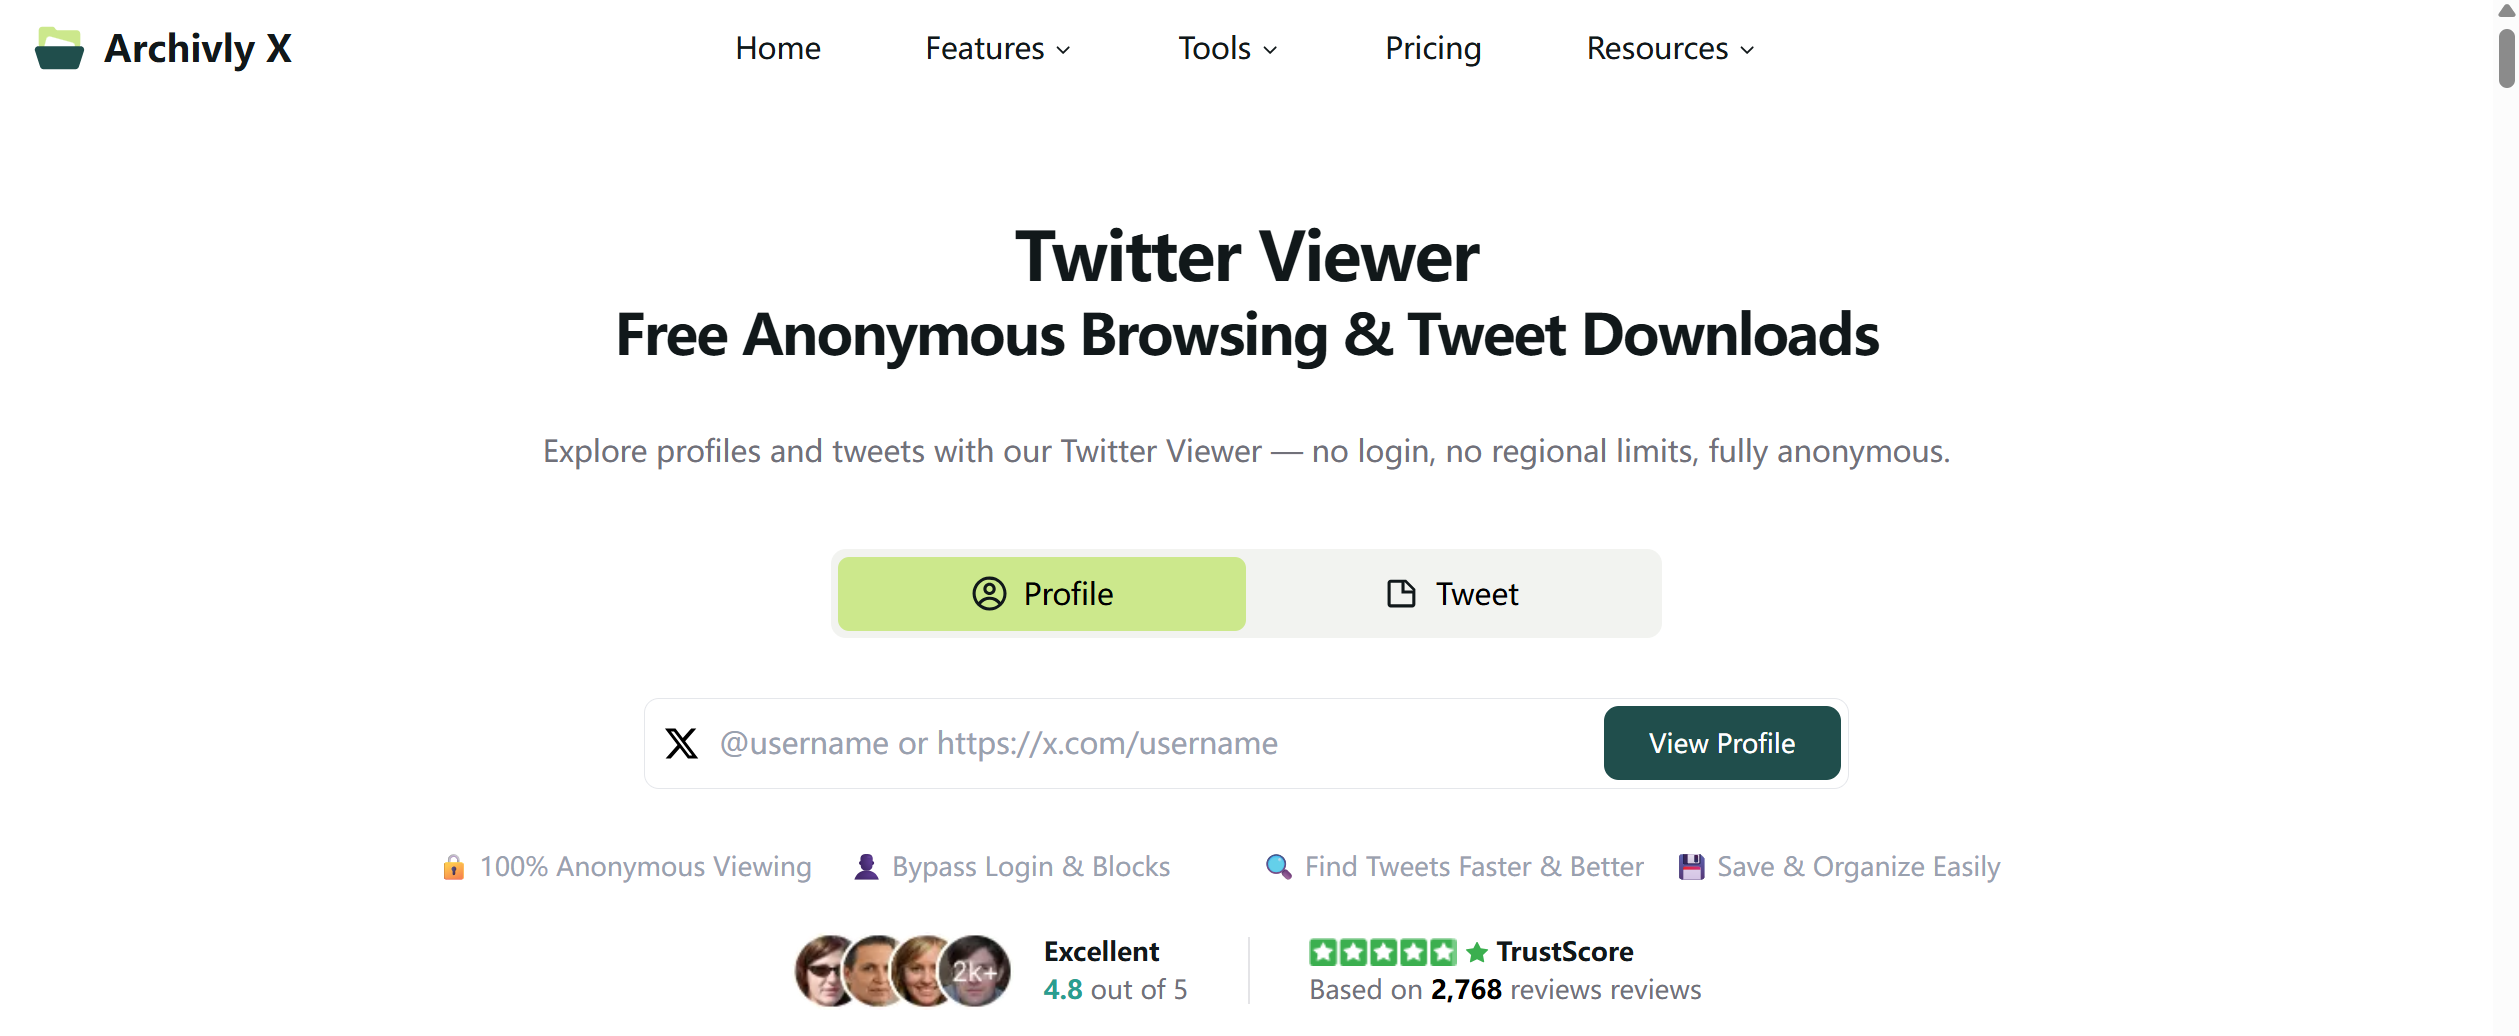
Need to Browse X Anonymously? ArchivlyX Has You Covered
No matter which group you fall into — creator, business, or casual user — there will be times you want to look at someone’s X profile without logging in. Maybe you’re researching a competitor’s campaign, checking out another influencer’s style, or simply curious about a public account that you can’t access normally due to regional restrictions.
That’s where ArchivlyX comes in. It’s a desktop browser extension designed for anonymous, hassle-free Twitter browsing. Here’s how it can help each type of user:
- For Creators & Influencers – Compare your performance with peers or find inspiration from trending content in your niche, without alerting anyone you’ve visited their profile.
- For Businesses & Marketers – Monitor competitor activity, track product mentions, or gather content ideas in markets where X is blocked or throttled.
- For Everyday Users – View and save tweets from favorite public accounts even if you don’t want to sign in — perfect for casual browsing without commitment.
Key Benefits:
- 100% free to use Twitter Viewer.
- Browse public Twitter profiles without signing in.
- Works in regions where X is blocked or limited.
- View and download images, videos, and GIFs directly.
- Clean interface with no ads or unnecessary clutter.
How to Use ArchivlyX:
- Install the ArchivlyX extension on your desktop browser.
- Open it and type the exact @username of the account you want to view.
- Instantly see their public tweets — anonymously.
- Save any media you want directly to your computer.
When to Use ArchivlyX vs. X Analytics
| Use Case / Goal | X Analytics | ArchivlyX | Best Combo Strategy |
|---|---|---|---|
| Analyze your own tweet performance | ✅ Yes – Full data on impressions, engagement, clicks, etc. | ❌ No – Only shows public content from others | Use X Analytics to refine your posting strategy |
| View competitor or public account activity | ❌ No – Can’t see others’ analytics | ✅ Yes – Browse anonymously and bypass restrictions | Use ArchivlyX to gather content ideas |
| Access X in restricted regions | ❌ Limited – Requires login and full access to X | ✅ Yes – Works without logging in | Use ArchivlyX to view, then track similar content in your own analytics |
| Download images, videos, GIFs | ❌ No – Not a media download tool | ✅ Yes – Download directly from public tweets | Use ArchivlyX for media collection, then post and track with X Analytics |
| Competitor campaign research + performance tracking | ❌ Not possible for competitor data | ✅ View content, but no internal metrics | Combine ArchivlyX viewing with insights from your own related posts in X Analytics |
💡 How to read this chart:
- If it’s about your own account data, X Analytics is the go-to.
- If it’s about viewing others without being seen or bypassing access limits, ArchivlyX takes the lead.
- For content inspiration + strategy refinement, use both — ArchivlyX to see what’s out there, X Analytics to measure how your version performs.
Ready to Level Up Your X Strategy?
Don’t just guess what works — see it, track it, and improve it.
- Use ArchivlyX Twitter Viewer to browse public accounts anonymously and access tweets in restricted regions.
- Open your X Analytics Dashboard to measure your own performance in real time. Use them together to get the full picture: what’s trending out there and how your content stacks up.


